Blog
Retailers are losing a trillion a year due to messed up size availability

Picture this. You see your dream dress on Instagram, practically begging you to wear it to your next event, so you tap to shop only to find out they don't have your size. Sound familiar? Unfortunately, it is far too familiar. Not only is this extremely frustrating for you, the loyal customer, but the retailer has lost out on a valuable sale.
This is happening millions of times a day across the world.
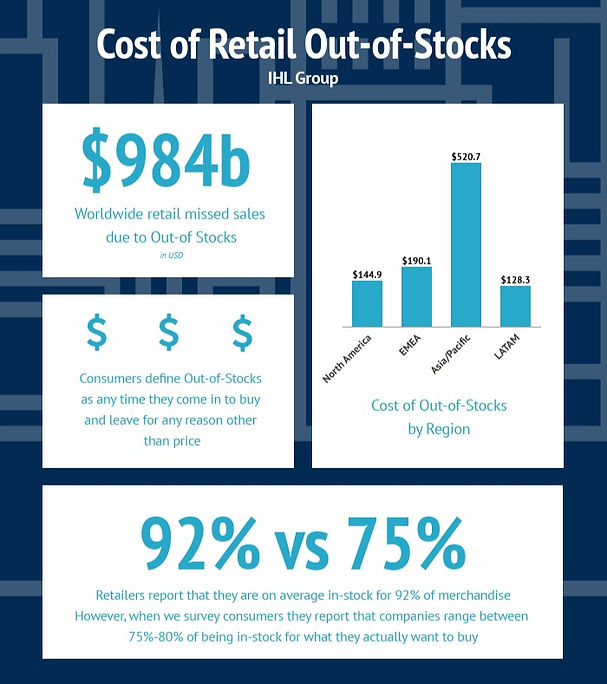
In fact, according to the retail analyst IHL, retailers globally lose $1 trillion in revenue annually due to out-of-stock situations. And, there are only so many times your customers will respond to “shop the restock” and “notify me when it’s in stock” requests.
It’s astounding that this loss is as much as it is considering what a vital step sizing is in the buying and fashion merchandising cycle.
After the range planning stage has been completed and the products and buy quantities are agreed upon, the next stage is deciding on how to split this buy quantity by size.
Listen up though, because this is where the current problem exists. There are so many ways this can be done and many of them are heavily flawed, which leads to a huge missed opportunity in sales and profit - we'll go into more detail on this later.
But first let’s breakdown all the important pieces and run through how they fit together.
A size run is all the sizes that a particular product is produced in. So for clothing you may have sizes XS to XL, or footwear you could have sizes 5 - 13.
If all of your sizes are instock for a specific product and available to sell, then you have a full size run. On the flip side, if one of your sizes is out of stock then you have the issue at hand which is broken sizing.
A size ratio however is a relative ratio that can be applied to your total number of buy units.
For example, if you were to be buying 80 units in Small, Medium and Large in a 1:2:1 ratio then your order would like:

But imagine you have a deadline and need to apply your ratio to a large number of products quickly (buying deadline feels anyone?). Or you have a size run that is 16 sizes long, that ratio is going to look wild.
It’s recommended then to actually take your ratio and convert it to a percentage that you can quickly apply. Your order would then look like:

A size curve, is a curve based on the distribution of buy units across the available sizes for a product. i.e. how much have you bought in each size for a particular product or category. An example size curve is below:

Initially, the size run for a product is determined by the designer/production team because they know how the garment needs to fit on the body and in what sizes it’s best suited. The size curve, or the quantity to purchase by size, is then determined by the merchandising teams.
Some merchandising teams spend hours and hours crunching the numbers in excel. From my experience, some don’t even bother with this job at all 😱
What would you rather? Easily apply the right size curve to the new range in seconds or spend hours trying to analyze a more accurate one? Argh! Therefore, time-poor merchandisers and buyers decide to miss this crucial stage entirely… absolutely horrifying!
Luckily Style Arcade’s Size Calculator takes the guesswork out of sizing in just a couple of clicks. Smart fashion technology can provide you with size curves by brand, category, exact SKU or across multiple brands and categories depending on your business requirements.
On average the cost of acquiring a new customer is somewhere in between $10-$22 USD for a fashion retailer, it’s not a cheap exercise.
So, imagine spending this to get your customer on to your website, or walk into your store, and then you lose the sale because they can’t find their size. 😩 If only marketing knew.
20-30% of profit in your business can be lost due to this exact problem. Let that sink in for a minute.
20-30% of your profit.
Gone.
Factor this in with the fact that on average 62% of customers shop once a month. If in that time they have a bad experience on your site, it’s unlikely they’ll come back any time soon.
Apart from losing a whole bunch of profit and disappointing your customer, here’s a few more reasons why buying the right size curve is one of the most important stages to get right:
There are a few ways in which a size curve/ratio is currently determined. I’ll run through a couple of examples and explain the flaws in each.
Firstly, you should always analyse units not values because units avoid the issue with variations in pricing.
Secondly, make sure your data set is statistically significant. Meaning you have enough data (and not just 2 days worth), and enough of the right data.
Sizing can differ massively from one brand to another or between categories. So ideally you would be pulling and analysing data based on these metrics. For example, by brand and by category to ensure you are getting it correct.
Anyone who has worked in buying or merchandising knows how complex sizing becomes particularly when dealing with categories such as footwear and denim. Your 5 sizes for womens fashion has just doubled for these categories as half sizes are available.
Not to mention missed opportunities that lay outside your usual size offering. Have you considered offering XXS or XXXL sizes?
As you can see it’s complex, but it doesn’t have to be with the help of merchandising tools to assist.
Some merchandisers will take the approach of comparing the sales units vs the intake units (number of units purchased) in each size across a given timeframe.
This is widely used because it is the simplest way to analyse the data. To provide a quick example of this approach, let’s analyse the sales of a product across a given timeframe below:

In its simplest format, you would review the data above and assume you need to buy more size M because it drove 38% of sales from 30% of intake.
In this example, you would increase your new size curve for size M to 38% of the buy and reduce size XL to 8%. Going forward the size curve you would want to apply to your new products is the Sales Mix % column above.
Seems simple right? But unfortunately this approach is riddled with flaws. Here’s why:
Some merchandisers will take a similar approach to example 1 but analyse sales only at full price to avoid the impact of units sold on promotion.
It’s labourious to manually calculate in excel for thousands of products, whether each individual sale was a full price sale or one on promotion. Taking the data from example 1 and looking at full price sales units only gives a different but more accurate result.

We have improved the accuracy of the size curve by analysing full price sales only - and you can see it has changed quite significantly.
Instead of buying 38% of units in a size M we would now only buy 26% because the sales were driven by a promotion. Size S is in fact the best selling size. You can see how misleading the data can be if you haven’t analysed it correctly.
Even though this example is an improvement, it’s still not perfect. This is because it doesn’t take into consideration size sellouts, which will underestimate the demand in a size. Because if you didn’t have the size in stock to begin with, how can you see the true sales opportunity of the size?
Because if you didn’t have the size in stock to begin with, how can you see the true sales opportunity of the size?
Perhaps there was a period of time in your data set where you sold out of a size XL before it was restocked. Therefore you could have sold more, but how much more?
The trick here is to ensure you are calculating your rate of sale when all sizes are in stock.
By doing so, a more advanced size curve model is calculated where you can see:
✅ the rate of sale,
✅ for a specific size,
✅ when it was in stock 🤯
This now allows you to optimise the sales you can make in each size, for each product, in each category.
You want to talk about buying for sales growth, THAT is a major lever to pull to get you hitting your sales targets.
SIMPLE. Well, not quite. This metric is impossible to extract in excel with large data sets. Fortunately, Style Arcade does the hard work for you with our exclusive True Rate of Sale - the rate of sale that your product sold. By Size. When instock.
Let's take a look at the example below showcasing a product's size curve when all sizes are in stock. The green line (sold units after returns) indicates how the product sold when all sizes are available for purchase. The Net Sold % row on the table tells us the size curve.

Now if we compare the same table for the same product, but look at week 15 (after 4 sizes have sold through). There's a large discrepancy in the size curves - as one shows what the sales would have been when all sizes were instock versus just selling what we have on hand (and hiding the missing sales opportunities in the sizes that are out of stock).

Compare the Net Sold % between the two tables below. Here you can see there is opportunity in Size S/8 and L/12 that were selling at a higher %, that then dropped once the stock ran out. (Because again, how can you sell what you don't have?)

Imagine placing a re-order using the size curve from week 15 instead of week 2, a very easy and costly mistake to make.
The simple answer is: every time you purchase new stock or raise new purchase orders. Sizing should form part of the buying and ranging process for every single product.
Given how time-consuming the current manual process is, often merchandisers only get round to it every quarter or sometimes not at all.
With the speed and accuracy of Style Arcade's Size Curve function, there’s no reason why even the most time poor teams should skip this step. Given the impact to overall business results, ensuring the correct size curves should be non negotiable.
As customer demographics are changing rapidly, and consumers are predominantly shopping online globally, it’s more important than ever to stay on top of the fluctuations happening in your size curves and ensure you get it correct 100% of the time.
Analyse size curves individually by product for items that are repeat styles or continuity lines (core lines), ideally basing on sales performance from when it last dropped so you take into account shifts in recent size trends. The worst thing you could be doing is basing it on sales made long ago when it first launched.
For new styles, analyse history at a granular level by country, store and category. It’s important to be granular because not all stores have the same sizing profile nor do all categories (crop tops vs t-shirts).
Even within the same category, there can be a wild variation in sizes from one brand to another. If you know that one brand runs small, or another runs large, it would be a crime to just group the curves together. You gotta break them out to see the accurate size curves for both.
Find out how Meshki used recommended size curves to achieve more profit and better sell throughs
Size Curves can be complex and time-consuming, but they don’t need to be. Given the negative impact incorrect sizing can have on your business, it’s worth investing in the tools that can alleviate the guesswork for you and ensure you are investing in the right sizes.
Questioning how your business is currently analyzing and calculating your size curves? Wondering how much profit you're missing? It's time to chat with one of our team to discuss how Style Arcade can help you to ensure you get it right every time.
Main image credit: Chimi