If you work in fashion retail, you’ve probably heard of, updated, or made critical product decisions from a WSSI. Don’t know what a WSSI is? You may know it as Open to Buy (OTB).
Whatever your local vernacular, if you’re a merchandise planner, buyer or trader, the WSSI (pronounced ‘wizzy’) requires you to update it each week, probably in a spreadsheet using fragile formulas (that take you more manual hours to maintain than actually being strategic). It will inform your discussions and decisions during your in-season and post-season planning, and of course, your weekly trade meetings.
It’s no secret a WSSI can be all-consuming and at times, totally confusing. So, use this complete guide to one of fashion’s most crucial tools and discover everything you need to know about the WSSI: what it is, why you need it, how to set your budget and forecast, as well as intake and purchase orders, cover, and how to use WSSI in scenario modelling.
Whether you’re new to the world of WSSI or need a solid refresher, this is the fashion retailer’s guide you’ll want to bookmark.
What is a WSSI?
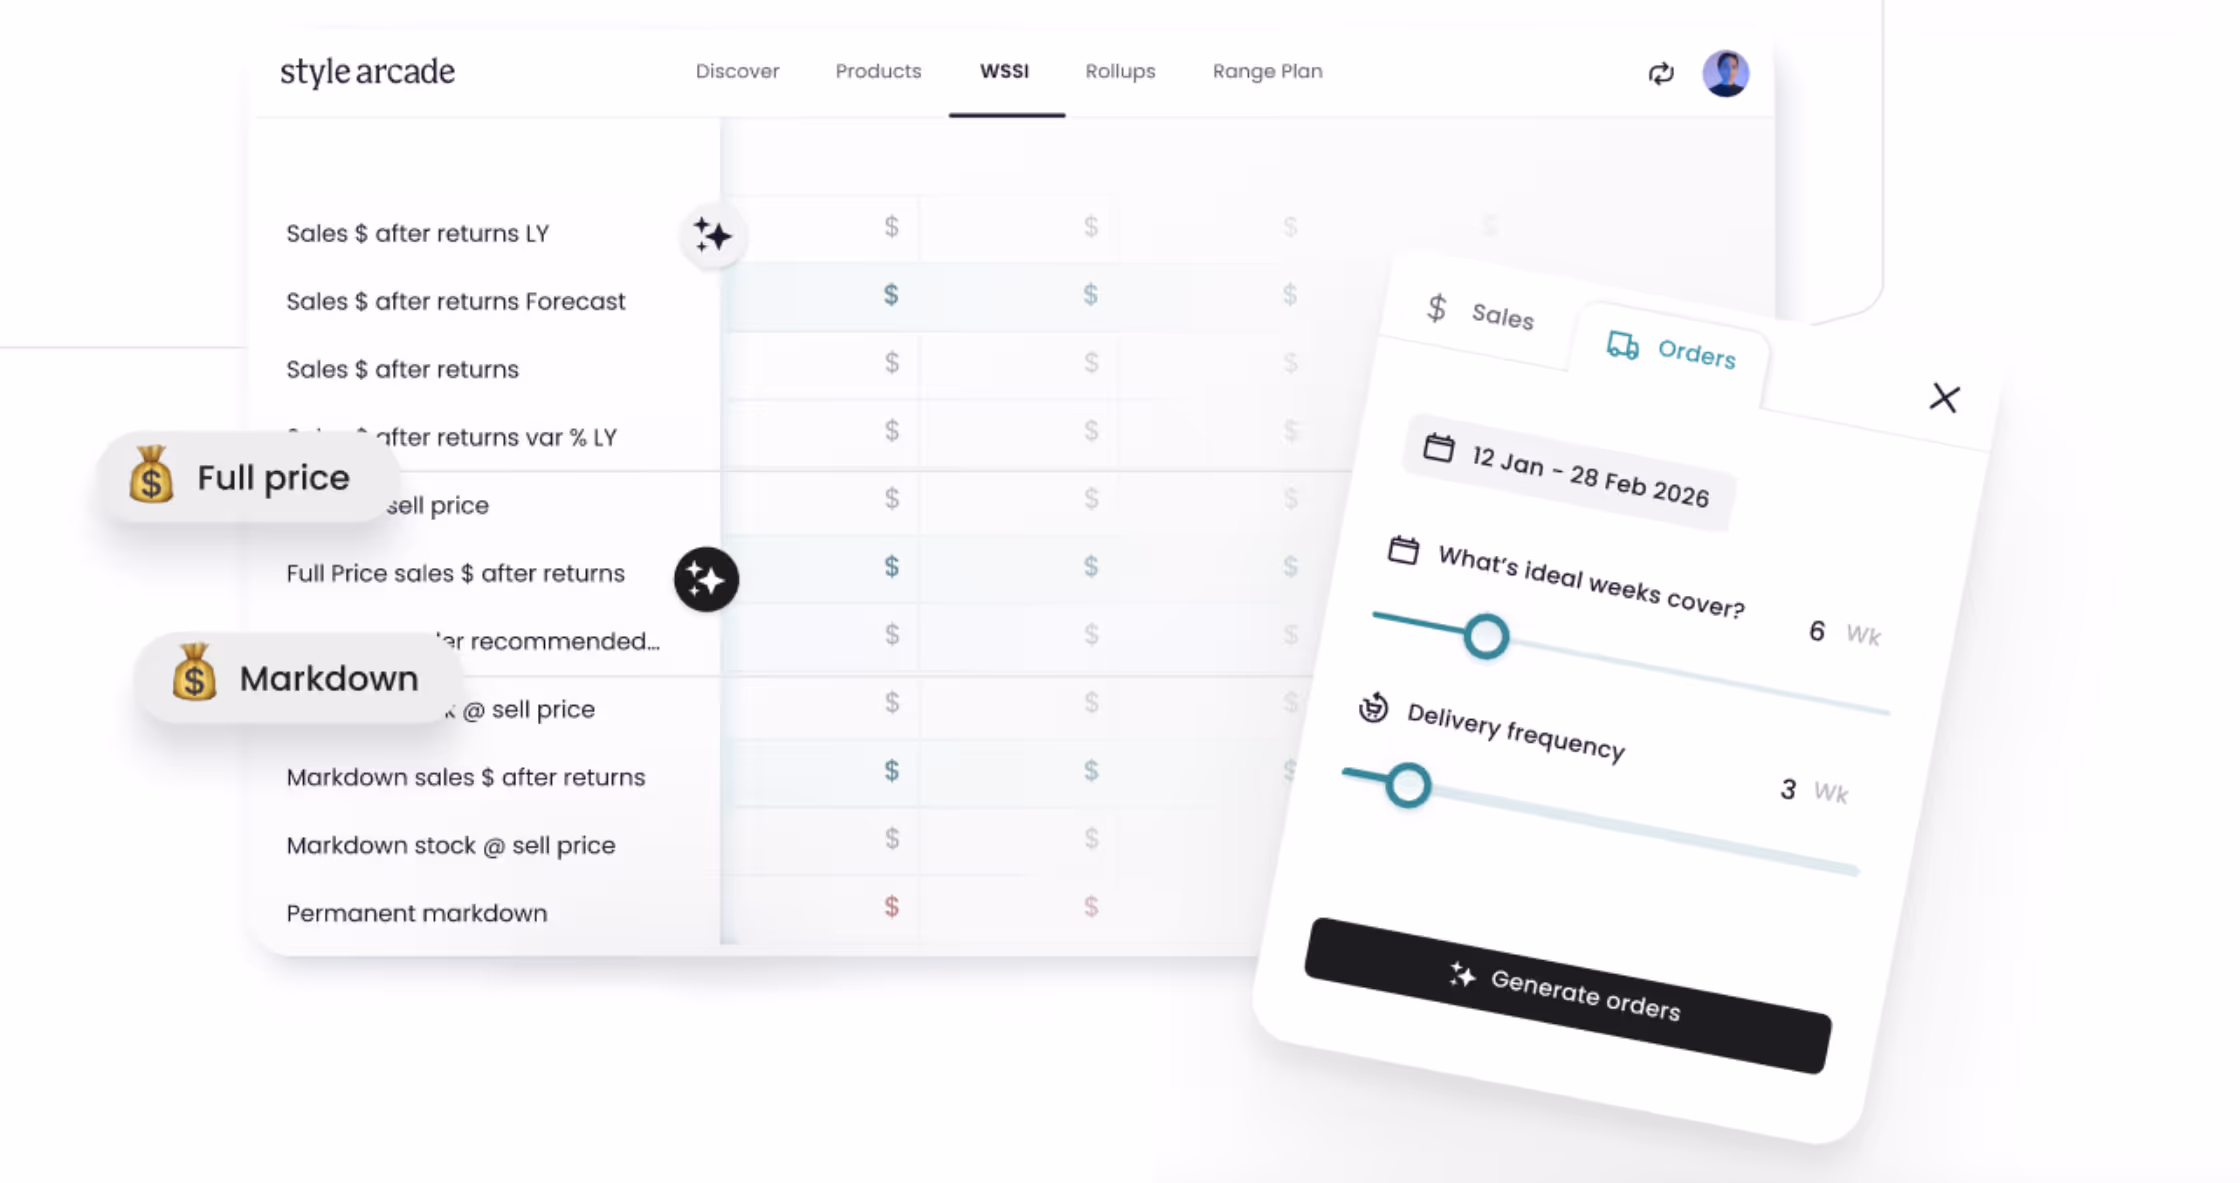
A WSSI stands for Weekly Sales, Stock & Intake, and is a core merchandise planning tool used by merchandise planners to manage inventory levels effectively. Some businesses operate on a monthly cadence, known as a MSSI (Monthly Sales, Stock & Intake).
At its heart, a WSSI helps planners ensure they are never under- or overstocked; that they are always holding the right amount of inventory to hit their sales forecasts. It drives three key decisions:
- Open to buy: How much stock do I need to reach my sales forecast?
- Identifying opportunity: Is there room to buy more stock and drive additional sales?
- Managing risk: Is stock building up? Do you need to take action to clear it?
In retail, stock is your biggest asset, so managing it carefully is critical to a healthy business.
WSSIs can be built at different levels depending on the size and structure of the business. Smaller businesses might track a single top-line view, while larger organisations build multiple WSSIs across categories, brands, and departments with dedicated planners managing each one.
What metrics does a WSSI track?
A WSSI can be set up across a range of metrics. A simple version might track units only across sales, stock, and intake, but most planners layer in sales dollars, stock dollars, and cost values too. Sometimes these live across separate WSSIs; sometimes they're all in one, though having all metrics together in a single view is generally the most useful setup.
How to set your budget
The starting point of any WSSI is the budget, specifically, the sales you want to achieve over the forecast period. For example, a team might set a target of $50 million in sales for the financial year, perhaps representing 10% growth on the prior year.
Budgets are typically informed by a post-season analysis, a review conducted across categories and brands to identify untapped opportunities from last year. From there, budgeting usually involves two perspectives that need to be reconciled:
- Bottom-up: The buying and planning team builds a detailed view across categories and brands
- Top-down: Management sets an overarching budget for the business
Once aligned, the agreed budget becomes the foundation of the WSSI.
Phasing the budget across the year is then the merchandise planner's job. They take that $50 million in sales and distribute it across the 52 weeks of the financial year, creating a weekly sales budget. This is typically done by using last year's trading pattern as a base, then adjusting for things like calendar shifts or key trading events, to arrive at the right weekly shape.

Budget vs forecast: How to manage performance through the year
Once the budget is set, it's locked in for the full financial year. It becomes the number the entire business is aligned to: marketing, buying, and planning teams are all working toward the same target. It doesn't change.
What does change regularly is the forecast.
Because no business hits its sales budget perfectly every single week, the merchandise planner's job throughout the year is to re-forecast the WSSI on a monthly basis.
Each month, they look back at how the prior period actually traded (did they hit budget, miss it, or beat it?) and then update the forward view accordingly. Maybe there's an opportunity to push beyond the original budget. Maybe sales have come in soft, stock has built up, and clearance activity needs to be factored in.
Within the WSSI, this creates three distinct lines that planners are always reconciling against each other: the original budget, the actuals (what has actually happened each week), and the forecast (the planner's latest view of how the rest of the year will play out).
The forecast reflects current information (delayed stock, shifts in trading patterns, changed market conditions) and will often look different from the budget in both total and weekly phasing.
Once the monthly re-forecast is completed and approved by the business, it becomes the new benchmark. From that point, performance is tracked against two numbers simultaneously: the original budget (the annual goal) and the latest forecast (the most current expectation). A planner might be reporting that they're 10% ahead of budget but 5% behind the latest forecast - both of those things can be true at once, and both matter. The budget tells you where you set out to go. The forecast tells you where you're actually headed.
That approved forecast then drives all inventory decisions for the coming weeks - how much stock to move, what to push forward or pull back, where open to buy sits - until the next monthly reforecast cycle begins again.
Within the WSSI, this creates three distinct lines that planners are always reconciling against each other: the original budget, the actuals and the forecast.
How to set your forecast
Always start with sales
Once the planner starts the re-forecast, they start with the sales phasing in the WSSI; everything else is built from there. Sales should always be the starting point, because sales represent demand.
Crucially, the sales planning shouldn't happen in isolation. To hit $50 million, a planner needs to think about it from multiple angles: How much stock needs to be bought to support those sales? But also, how many customers are needed to get there? What conversion rate is required? What is the average order value? The buying and merchandising side of the business needs to be aligned with customer and marketing insights, so that everyone is working toward the same goal with a shared understanding of what it takes to get there.
Building out the remaining metrics
With sales phased, the next step is layering in the remaining metrics.
1. Returns
If the business tracks returns, these are forecasted weekly within the WSSI. Because return rates can fluctuate significantly week to week, it's important to look at a minimum 12-week rolling period to establish a reliable average before using it as the basis for forecasting.
The critical principle here: all stock and cover calculations should be based on net sales after returns, not gross sales. This prevents overbuying because returned stock comes back into the business and needs to be resold. For businesses with high return rates of 40–50%, this is especially important to manage carefully. At any given time, a significant portion of stock could be sitting outside the warehouse in transit back from customers, which has real logistical and cash flow implications.
2. Profitability & markdowns
Gross profit is arguably the most important metric tracked in a WSSI, and it flows directly from how markdowns are managed. Markdown percentage and profit percentage should both be tracked weekly so planners can see in real time how discounting activity is affecting the bottom line.
Going into sale periods, it's normal to see profitability dip as markdown depth increases. The goal is to manage that carefully across the full year. As a general guide, a markdown rate of around 20% across a 52-week financial year is a reasonable target. Combined with a strong intake margin - say 75% - a business might expect to land at a gross profit in the region of 60%, though this varies by business model.
3. Clear as you go (CAYG)
One of the most common and costly mistakes in retail inventory management is leaving markdowns too late. Waiting too long means having to discount far more aggressively to shift product - sometimes 50% off or more - and even then it may not clear. A much healthier approach is to act early.
If a product hasn't moved at the expected rate after around 8–10 weeks, the recommendation is to take a first markdown, often as low as 20% off. This is enough to nudge it without significantly damaging the margin, and it keeps inventory healthy over time. This approach is known as "clear as you go."
Before going straight to a markdown, it's worth exploring other levers first: featuring the product in marketing activity, repositioning it on the website, or reviewing the copy and imagery.
But if those efforts haven't shifted the needle after a couple of months, a quiet markdown is often the right call. It doesn't have to be loud or promotional; customers will find it. The goal is simply to keep stock moving and avoid a build-up of slow product that becomes increasingly expensive to shift.
Intake & purchase orders
The WSSI isn't just a snapshot of today; it runs continuously, often spanning two to three years in both directions. This means planners can look back at any point in time to understand what stock came in, whether it drove the expected sales uplift, and how it affected cover. And looking forward, all raised purchase orders are visible in the weeks they're due to land, giving a clear picture of how incoming stock will affect inventory levels and cover week by week.
But before any of that forward planning can be trusted, the purchase order data itself needs to be clean. This is one of the most common problem areas in retail planning. A kind of black hole where orders placed in the past haven't been marked as received, leaving them sitting as outstanding with no clear status. Are they still coming? Have they arrived? Nobody's sure. That ambiguity has a direct and significant impact on the accuracy of any WSSI forecast.
So before building or refreshing a WSSI forecast, it's worth doing a purchase order reconciliation first. That means going through all orders and making sure each one has an accurate status, received orders marked as received, and outstanding orders confirmed as still on order with the correct expected delivery date. It sounds administrative, but it's foundational.
A WSSI built on messy purchase order data will produce an unreliable picture of future stock levels, which then cascades into bad cover calculations, poor buying decisions, and inventory problems down the line.
Once purchase orders are clean and up to date, the WSSI gives a genuinely clear view of what stock is on hand, what's confirmed incoming and when, and critically, what still needs to be bought. That gap is called the open to buy (OTB).
Open to buy is the amount of stock that still needs to be purchased to hit the sales target and maintain the right cover position. If the plan calls for ten weeks of cover but certain weeks are forecast to dip to seven or eight, the WSSI will show exactly how much additional stock is needed and in which weeks. That figure - the open to buy - is what the merchandise planner hands to the buyer as a brief.
And the more granular the WSSI, the more useful that brief becomes. If WSSIs have been built at the category or brand level, the open to buy can be broken down accordingly, not just "we need another $1 million of stock in week 14" but "we need it in these specific categories, based on where cover is tightest and where the sales opportunity is strongest."
That level of direction is what gives buyers the best possible chance of spending in the right places and hitting the sales plan.
A WSSI built on messy purchase order data will produce an unreliable picture of future stock levels, which then cascades into bad cover calculations, poor buying decisions, and inventory problems down the line.
Cover: the key measure of stock health
Cover - sometimes looked at alongside sell-through - is one of the most important metrics in the WSSI. It answers a simple but critical question: based on my current stock and my future sales forecast, how many weeks will my inventory last?
For example, if a business is holding $1 million in stock and has $100,000 in net sales planned each week for the next ten weeks, they are sitting on ten weeks of cover.
Actual forward cover vs. average forward cover
There are two ways to calculate cover, and the difference matters significantly.
Average forward cover takes a blended view. It looks at average weekly sales over a future period and uses that to calculate how long current stock will last. The problem is that averages can be misleading. If sales are heavily weighted to the next two weeks - a peak trading period, for example - but then fall sharply, building stock to an average figure means overbuilding for weeks that don't need it.
Actual forward cover is the more accurate and recommended approach. It uses the real week-by-week sales forecast, so the calculation reflects exactly when demand is expected - not a smoothed average that can obscure peaks and troughs. This is what allows planners to make genuinely informed decisions about when stock is needed, in what quantity, and when to act if cover is building too high or running too low.
What's the right level of cover?
The ideal cover level varies significantly depending on the business model. For a fast-paced fashion retailer with short lead times, six to eight weeks of cover is a good target.
The logic is simple: If you can get stock quickly, you should turn through it quickly. A lean cover model drives strong stock turn, keeps the range feeling fresh, and means that when an opportunity is identified, you can double down on it fast.
For businesses with longer lead times (where stock needs to be placed six months in advance) the model looks quite different. Planning needs to be more thorough up front, and the business will naturally carry more cover as a result. However, this model has its own advantages: buying larger quantities further ahead typically means better supplier negotiations, the ability to ship by sea rather than air freight, and therefore stronger margins.
A useful middle ground that many longer lead-time businesses use is phased delivery.
For example, committing to 10,000 units with a supplier but taking 2,000 per month over five months. The supplier holds the bulk stock, reducing warehousing pressure on the retailer. The WSSI then becomes an essential tool for managing those phased deliveries dynamically: if cover is running high, push deliveries out; if a product is selling faster than expected and cover is dropping, pull deliveries forward.
Rule of thumb: An ideal cover position is around 10 to 12 weeks, and the WSSI is what helps planners model what they need to do to get there, whether that's rescheduling deliveries, running a flash promotion, or taking a markdown.
Using the WSSI to scenario model
One of the most powerful uses of the WSSI is scenario modelling. Playing out "what if" questions in real time:
- What happens to cover if I push these deliveries out by two months?
- What if I pull them forward?
- What if I run a promotion on this slow-moving category?
These are the levers a planner has to pull, and the WSSI makes the impact of each decision visible before it's made.
Alongside the internal stock levers, customer signals should be pulled into the WSSI too. Metrics like conversion rate and average order value sit alongside the inventory data to give a fuller picture of what's driving (or limiting) sales performance.
Where to focus: the 80/20 rule
Not every category or brand warrants the same depth of planning. For businesses with 20 or 30 categories, some will only contribute a few hundred dollars of sales per week - planning to that level of granularity isn't worth the time. The better approach is to focus energy on the categories or brands that drive 80% of the business, because in most retail businesses, roughly 20% of the range will account for 80% of sales.
Building and actively managing WSSIs for those top categories is where the real value lies. That's where planners should be optimising profitability, improving conversion, increasing units per transaction, and working to grow average selling price, ideally through reducing the need for markdowns rather than pushing retail prices up.
Get those categories right, and the rest of the business tends to follow.
By simply following these steps, you'll be able to compete your WSSI with confidence and ensure you're optimizing your products for profitability, each week and every season.
Want more fashion merchandising step-by-steps?
Download the Merchandiser's Trade Playbook
A practical, action-first guide to improving product performance with product data, built to help fashion buyers and merchandisers understand what’s working, what’s not, and know exactly what to do next across metrics, channels, range and timing.